🍂 Fall Special Offer - Save up to 40% on your first 3 months with Paymo!
Check plans and prices
Plan, schedule, and display your project on a visual timeline
Create dependencies and see all the tasks displayed against time.

Simple Gantt Charts for project planning
The Gantt Chart offers a clear picture of the project progress and helps you identify bottlenecks early on.
Plan projects

Schedule tasks automatically
How do you create a Gantt Chart? In Paymo, all you need to do is set up tasks with a start and end date. Their duration will automatically show up on the project timeline, so you know when to deliver them. You can also schedule tasks using drag & drop.

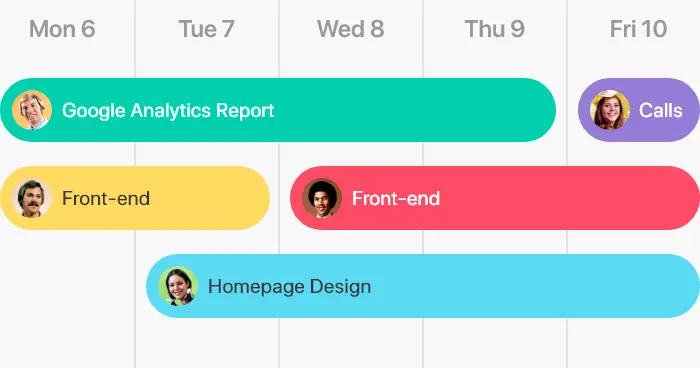
See who’s responsible for each activity
The Gantt Chart tells you which team members should be working on what tasks on any given day. Pair this up with user filters, and you’ve got yourself a clear picture of the deadlines, performance, and remaining work, without having to micromanage or overburden them.

Create dependencies
Task dependencies show you which tasks need to be finished before others start. You can also go one step further and account for an overlap (lead time) or delay (lag time) between two consecutive tasks, a vital hint in maintaining a project plan free of “surprises.”
Schedule tasks

Spot the most critical tasks
The most critical tasks are not the most difficult or most cost-intensive ones, but those that, when changed, can influence the entire project duration. Learn upfront which activities are critical and which is the shortest path to deliver your project on time and on budget.

Identify issues and make adjustments
To make sure tasks move according to the project plan, the Gantt Chart offers visual cues on problems during the project lifecycle: past due tasks and broken dependencies. Make adjustments manually or let the system do the job for you via the auto-scheduling feature.

Share the project’s progress
Does updating your clients about the project progress take ages? Do it right after the project kick-off to evaluate your team’s performance against the project baseline. Export the Gantt Chart as a PDF/PNG to keep them in the loop.
Monitor progress

Get a bird’s eye view of all projects
If you’re in charge of your company's entire portfolio of projects, the Portfolio Gantt Chart gives you the big picture of all active projects. Use it to maintain a balanced project pipeline and know whether you have enough capacity to take on new projects.

Visualize task progress
As a project manager, knowing who works on what and when is half the story. You still need to know how things are progressing at a micro level, not just macro. The Gantt Chart will offer you visual indicators of the percentage of hours worked from the total allocated time.

Use advanced settings
When planning projects, a few extra tweaks are needed. View the project timeline in different formats – “Fit” will automatically choose the one that fits your screen. Filter down after the status of a task or display a burndown graph of the worked time for greater control.

We use the Gantt Charts to overview the visual project planning for the customer and team. Since every employee only sees their tasks, it is easy to show them a compact project overview.
Israel Galvez Gil
CEO
@Galvez Gil E-Commerce Consulting
Explore other features
Time tracking
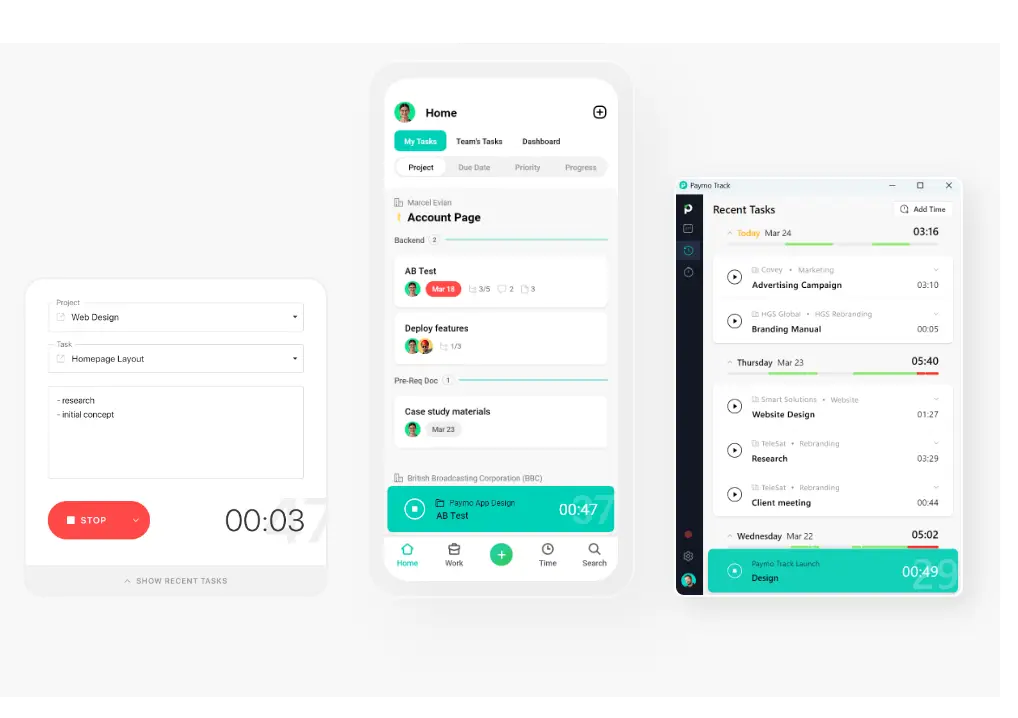
Log work time manually–via the web timer or the mobile tools–and automatically with Paymo Track.

Resource management
Manage workloads, availabilities, and leave days on a visual schedule, and see at a glance who’s overbooked or underbooked.

Project invoicing
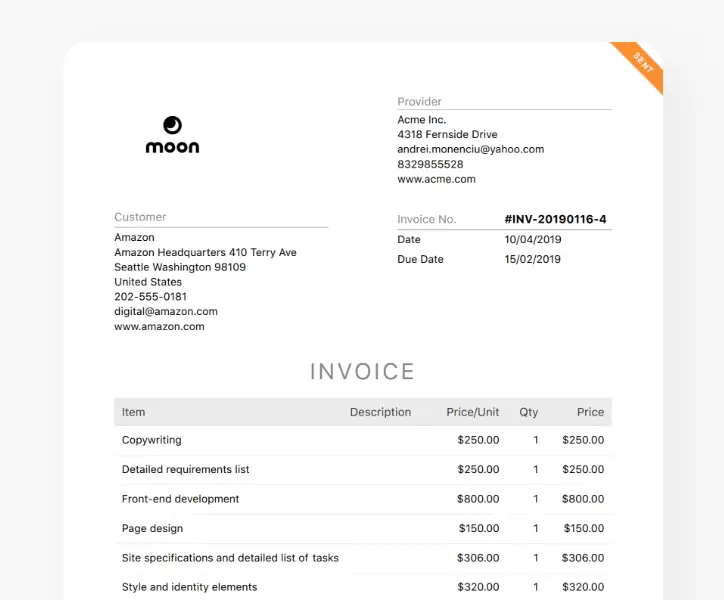
Create estimates, manage expenses, generate invoices and send them to your clients. Get paid online via the payment gateway integrations.

Join Paymo today and increase your team’s efficiency
Resources
Project Management GuidePM Software for CreativesPM Software for ArchitectsKanban SoftwareProject Management SoftwareBest Time Tracking SoftwareEmployee Time Tracking SoftwareTime Tracking Software for ConsultantsFree Invoicing SoftwareTask Management SoftwareTimesheet SoftwareResource Management SoftwareGantt Chart SoftwareTime Tracking AppsHow to Become a Project ManagerProject TrackerHow to Increase ProductivityProject Management MethodologiesCopyright © 2025 Paymo LLC
By signing up, you're agreeing with the Paymo Terms of Service and Privacy Policy
Cookies help us deliver our services. By continuing to use the website, you consent to the use of cookies.
Learn more about the cookies in Our Privacy Policy.

 Desktop App
 Mobile App
 Integrations